
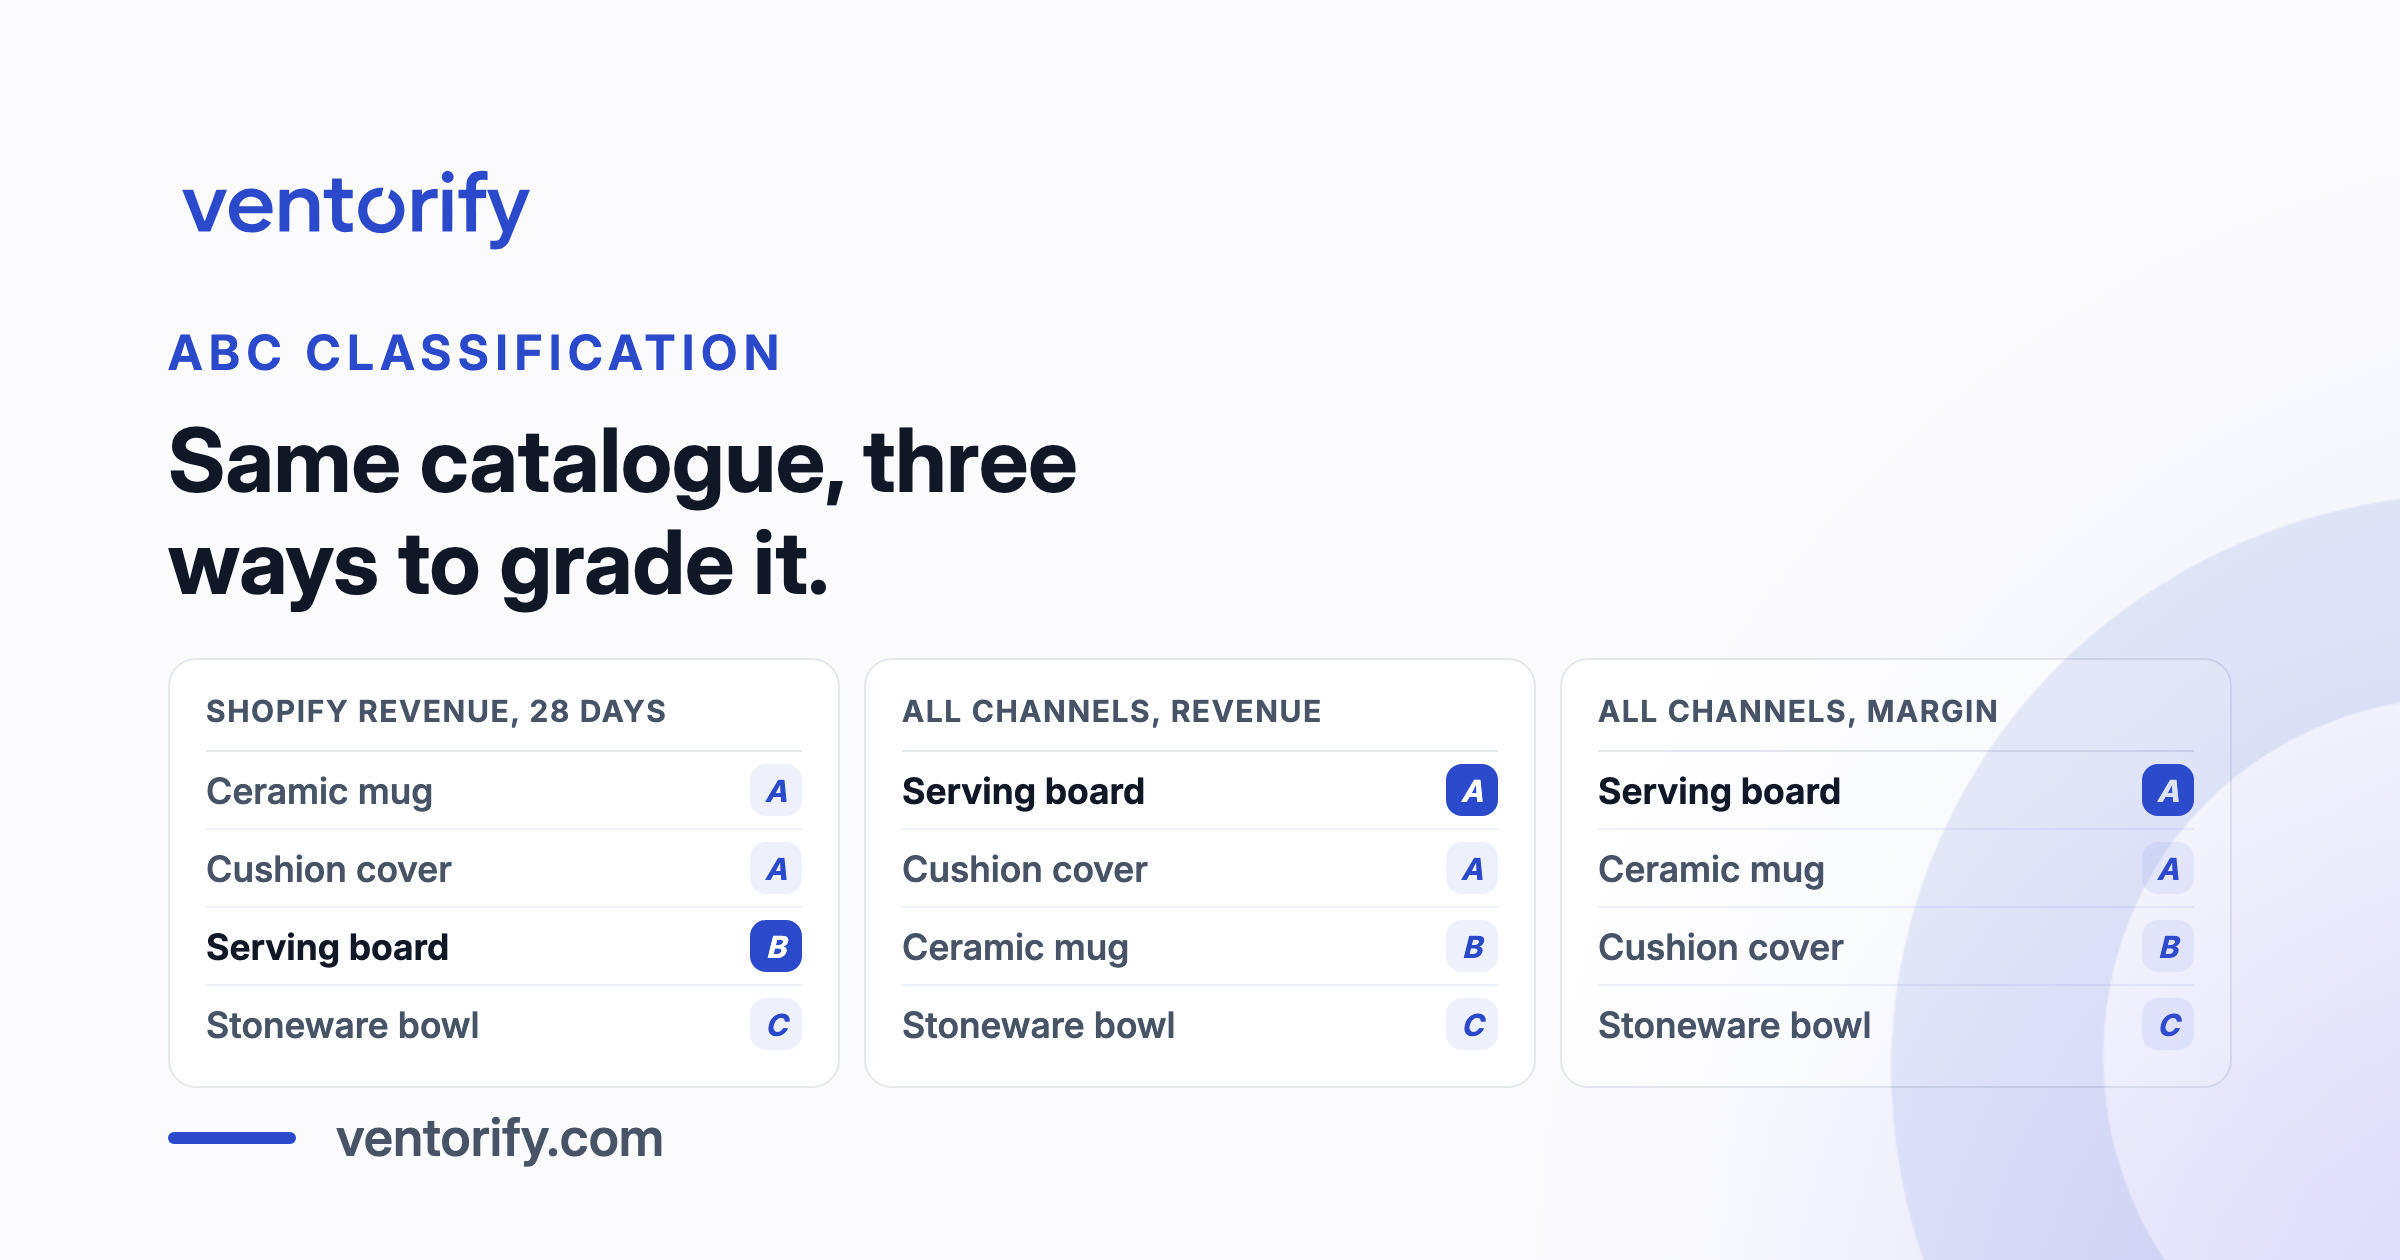
Any Shopify store can produce an ABC report in about four clicks. Very few do anything with it. The report grades your products A, B and C, and then it stops, which is exactly where the useful question starts: what do you do differently for an A product than for a C product? Without an answer, the grade is a column of letters, and a column of letters is not an inventory policy.
This post supplies the missing half: what the grade is actually computed from, which is less than most merchants assume, what happens to that computation when a meaningful share of your orders arrive from outside Shopify, and how much buffer each class earns once the letters are right. Then the second axis nobody mentions, the one that decides whether any of this arithmetic applies to a given product at all.
Key Takeaways
- ABC classification only earns its keep when a different decision hangs off each letter. The decision with a price tag is the service level, and through it, the safety stock.
- Shopify's built-in report grades on 28 days of retail revenue, excludes discounts, and states plainly that item cost does not factor into the grade.
- If you sell on more than one channel, a grade computed from one channel's revenue is ranking your catalogue on a fraction of its demand. Products change class when the rest is included.
- Ranking on margin rather than revenue reorders the catalogue again, because the most expensive product and the most profitable product are rarely the same one.
- Tiered service levels by class beat one catalogue-wide target, but the ranking criterion is doing more work than most guides admit, and the research literature disputes the simple version.
- Value is one axis. Whether demand is predictable enough for a buffer calculation to mean anything is a separate one, and the products that fail it are not always the cheap ones.
A grade is not a policy
ABC classification is the Pareto observation applied to a catalogue: a small share of products carries most of the value, and a long tail carries very little. Splitting the catalogue into three classes is only useful if you then treat the classes differently, and there are four decisions you can reasonably hang off a letter: how often you count the product, how often you review its numbers, how much supplier attention it gets, and how much buffer stock you hold for it.
The first three cost you time. The fourth costs you money, every day, in stock sitting on a shelf, which makes the service level the decision worth getting right. It is the probability you are willing to accept of not running out during a replenishment cycle, and it enters the safety stock calculation as the multiplier Z. What that formula does with it is covered in the buffer formula the service level feeds into; this post is about who deserves which value.
What Shopify's report actually grades
Shopify's ABC analysis grades products by their share of revenue over the last 28 days: A-grade products collectively account for 80% of revenue, B-grade for the next 15%, and C-grade for the last 5% (Shopify Help Center). That is a reasonable default and a real, free, always-current report, which is more than most merchants have.
Two details in the documentation are worth reading closely, because they define what the letters can and cannot tell you. Shopify states that the revenue in the report is calculated on the retail price of items and excludes discounts, and that the cost of the item does not factor into the calculation of a product's grade (Shopify Help Center). So the grade is a ranking by gross sales at list price. Not by profit, and not by what you actually collected.
The 28-day window has its own consequence. It keeps the report responsive, which is the point, but it means a product with a monthly rhythm can be graded on a fraction of a cycle, and a seasonal product will change class as its season arrives and leaves. If you set service levels from a 28-day grade and recompute them weekly, you will spend the year chasing classes that are partly measuring noise.
On several channels, a one-channel grade is a guess
Here is the part that matters most if you sell anywhere besides your own store, and the part no version of this report can fix. Shopify grades on Shopify revenue. Your marketplace orders are not in it. If a third of your units move on external channels, the report is ranking your catalogue on two thirds of its demand, and it is not a random two thirds: the products that travel well on marketplaces are systematically the ones being understated.
Watch it happen on four products. The numbers below are round ones chosen for the arithmetic, not measured from anything, over the same 28 days.
| SKU | Shopify units | Shopify revenue | All-channel units | All-channel revenue |
|---|---|---|---|---|
| Ceramic Mug 350ml, Sage (CM-350-SAG) | 180 | $2,520 | 210 | $2,940 |
| Linen Cushion Cover 45×45 (LC-4545-NAT) | 60 | $2,340 | 78 | $3,042 |
| Oak Serving Board (OSB-M-OAK) | 26 | $1,768 | 78 | $5,304 |
| Stoneware Bowl 18cm (SB-180-CRM) | 9 | $198 | 14 | $308 |
On Shopify alone, the mug is the store's number one product at 36.9% of revenue, the cushion is second at 34.3%, and the serving board sits third at 25.9%, which puts it past the 80% cumulative line and into B. On combined demand the ordering inverts: the serving board is number one at 45.7%, comfortably A, and the mug falls to third.
The board is a B-grade product in the Shopify report and the largest revenue line in the business. It is a giftable premium item, which is precisely the sort of thing that sells on marketplaces without needing your brand to do the work, and it is the product the one-channel grade is least equipped to see. Building the demand series that produces the right column is the procedure in pulling orders from every channel into one daily series, and the reason the combined series is the only defensible input is argued in full in the cross-channel forecasting pillar.
Revenue, or what the product actually earns you
Now change the criterion rather than the data. Revenue-based grading promotes whatever is expensive, and expensive is not the same as worth protecting. Add cost prices to the same four products:
| SKU | Margin per unit | All-channel margin, 28 days | Share |
|---|---|---|---|
| Oak Serving Board (OSB-M-OAK) | $24 | $1,872 | 39.1% |
| Ceramic Mug 350ml, Sage (CM-350-SAG) | $8 | $1,680 | 35.1% |
| Linen Cushion Cover 45×45 (LC-4545-NAT) | $14 | $1,092 | 22.8% |
| Stoneware Bowl 18cm (SB-180-CRM) | $10 | $140 | 2.9% |
The catalogue reorders a third time. The cushion, second on combined revenue, drops to third on margin, because a 36% margin on a $39 item earns less per unit sold than a 57% margin on a cheap one that moves in volume. Across the three views the mug has been first, third and second, and it is the same mug.
None of the three orderings is wrong. They answer three different questions, and the mistake is not picking the wrong one, it is not knowing which one you asked. Rank on margin wherever cost prices support it, because a service level is answering how much a stockout costs you, and that is a margin question. The pillar's treatment of the two criteria covers the fallback case.
The service level each class earns
Now the letters can do their job. The conventional split is roughly 98% for A products, 95% for B, and 90% for C, and the spacing between those numbers is the whole argument. The corresponding multipliers are about 1.28 at 90%, 1.65 at 95% and 2.05 at 98%, and they keep climbing without bound as the target approaches 100%. Protection near certainty is asymptotically expensive, so the money you spend at the top of the curve should go to the products that would hurt most to lose.
Price the misgrading from earlier. The serving board carries a safety stock of 25 units at a 98% service level and 21 units at 95%, using the demand and lead time spreads worked out in the safety stock guide. Graded B on Shopify revenue, it holds 21. Graded A on combined margin, it holds 25. Four units of protection, withheld from the single largest margin line in the catalogue, because the report that set its class could not see two thirds of its sales.
One honest caveat belongs here, and it cuts against the tidy version of this advice. Teunter, Babai and Syntetos found that using demand value or demand volume as the ABC ranking criterion, with fixed service levels per class, produces solutions that are far from cost optimal, and they note that which class should carry the highest service level has been disputed in the literature ("ABC Classification: Service Levels and Inventory Costs", Production and Operations Management 19(3), 2010, 343 to 352, DOI 10.1111/j.1937-5956.2009.01098.x). Their proposed criterion ranks on the cost consequence of the stocking decision itself rather than on sales.
Read that as a statement about where the remaining money is, not as a reason to abandon the method. Tiering by class is a large improvement on running the whole catalogue at one number, which is what most stores do. But the criterion you rank on is not a detail, and any guide presenting value-based ABC as settled practice is skipping the part the research argues about.
Value is one axis. Predictability is the other
Classification tells you what a product is worth. It says nothing about whether the product's demand is stable enough for a buffer calculation to produce a meaningful number, and those are independent properties.
The measurement is the coefficient of variation: the standard deviation of daily demand divided by its mean. A product selling 30 a day, give or take four, has a coefficient near 0.13 and behaves. A product selling 0.5 a day in occasional lumps of six has one near 3.4 and does not. Layering that axis onto ABC is usually called ABC XYZ analysis, with X for stable, Y for moderate and Z for erratic demand. The threshold values you will see quoted, below 0.5 for X and above 1.0 for Z, circulate widely on vendor sites without a primary source behind them (SCM Dojo). Treat them as a working convention to calibrate against your own catalogue, not as a standard.
The cell that quietly breaks is the erratic one, at any value class. The stoneware bowl above is a C product, so nobody looks twice at it, and its 90% service level produces a buffer of about 10 units from a formula that assumes roughly normal daily demand. This product has never sold 0.5 units on any day in its life. It sells six at a time, a few times a month, and the buffer is both dead stock during the silent weeks and no considered answer to the only question that matters, which is whether an order lands during the wait. That failure is walked through in where the normal-demand assumption breaks down.
A high-value product can land in the same cell, which is when it gets expensive. An A-grade item with erratic demand gets handed a 98% service level and a confidently wrong buffer, and its class is the reason nobody questions the number. Products there need methods built for sparse demand, or an honest statement that the history is too thin to forecast. Running that classification continuously, on combined channel demand, with service levels set per class and an explicit insufficient signal marker where the data will not support a forecast, is what Ventorify's forecasting engine does with these two axes.
Frequently asked questions
What service level should A items have?
Around 98% is the common target, with roughly 95% for B and 90% for C. Treat those as starting points, because the right number depends on what a stockout costs you against what the buffer costs to hold, and buffer cost rises steeply as the target approaches 100%. The discipline that matters is that the classes get different numbers at all.
Does Shopify's ABC analysis include my marketplace sales?
No. The report grades products on your Shopify revenue over the last 28 days. Orders placed on external channels are not in that calculation, so on a multichannel catalogue the grades systematically understate whichever products sell best away from your own store.
Should ABC classification use revenue or profit?
Use margin wherever you have reliable cost prices, because the service level is answering a question about the cost of a stockout. Revenue is a reasonable fallback when costs are missing or unreliable. Shopify's own report is revenue-based and documents that item cost does not factor into the grade, so if you want margin-based classes you are computing them yourself.
How often should ABC classes be recalculated?
Often enough to catch genuine drift, rarely enough that products are not changing class on noise. A short window makes classes responsive and unstable at once, and a service level that changes every week is not a policy. Recomputing daily is fine when the underlying window is long enough that one busy week cannot move a product two classes.
What is ABC XYZ analysis?
It is ABC classification crossed with a second axis for demand variability, measured with the coefficient of variation. ABC ranks products by value, XYZ ranks them by how predictable that value is, and the combination separates products that merely look similar on a revenue report into groups that need genuinely different treatment.
Where this leaves you
Grade on all your demand, not one channel's. Grade on margin if your cost prices are good enough to carry it. Attach a service level to each letter so the classification drives a decision instead of describing one. Then check the variability before you trust any buffer the arithmetic hands back, because the products where the calculation quietly fails are not all sitting in the C class.
The letters were never the output. The buffer was.