

The reorder point formula takes thirty seconds to find and it is correct everywhere you find it. What none of those pages tell you is what to do first when your sales arrive through three different checkouts: which exports to pull, how to make three order histories agree that they are talking about the same product, and how to turn the number the formula produces into an order your supplier will actually accept.
That is this post. It is a follow-along procedure, five steps, done in a spreadsheet with data you already have. By the end you have a reorder point per SKU that was computed from every channel you sell on, not just the one whose dashboard you look at most. The reasoning behind the method lives in our guide to demand forecasting on more than one channel; this page is the part where you open the spreadsheet.
Key Takeaways
- The reorder point formula does not change when you sell on several channels. The demand series that goes into it does: one combined daily series per SKU, not one per channel.
- You need about 90 days of order history from each channel, and a SKU mapping that reconciles what each channel calls the same product. The mapping is the step most guides skip and most merchants hit first.
- Measure lead time from your last 10 to 20 purchase orders, order date to received date. The supplier's quoted lead time is not an input.
- Safety stock comes from two variabilities, demand and lead time, and the lead time term is usually the larger one.
- The reorder point is a trigger, not an order quantity. The order you place is your need rounded up to the supplier's minimum order quantity and pack size.
- Recalculate quarterly, or when a channel is added, a supplier changes, or velocity visibly shifts.
The formula stays. The demand series changes
The reorder point is the stock level at which you place the next order:
reorder point = (average daily demand × lead time) + safety stock
Selling on several channels changes none of the symbols. It changes what goes into the first one. Average daily demand means the total across every channel that ships from the same pool of stock, because one pool has one drain rate, and the formula is a statement about the pool. Why the channels combine into a single series, and why running the formula per channel gets both the trigger and the buffer wrong, is argued in full in the pillar guide. Here we take it as given and do the work.
One scope note before the first export. This procedure is for stock you ship yourself, whatever channel the order came from. Stock that sits in a marketplace's fulfilment network, Amazon FBA being the common case, is a separate pool draining on its own schedule, and it stays out of this calculation entirely.
Step 1: pull 90 days of orders from every channel
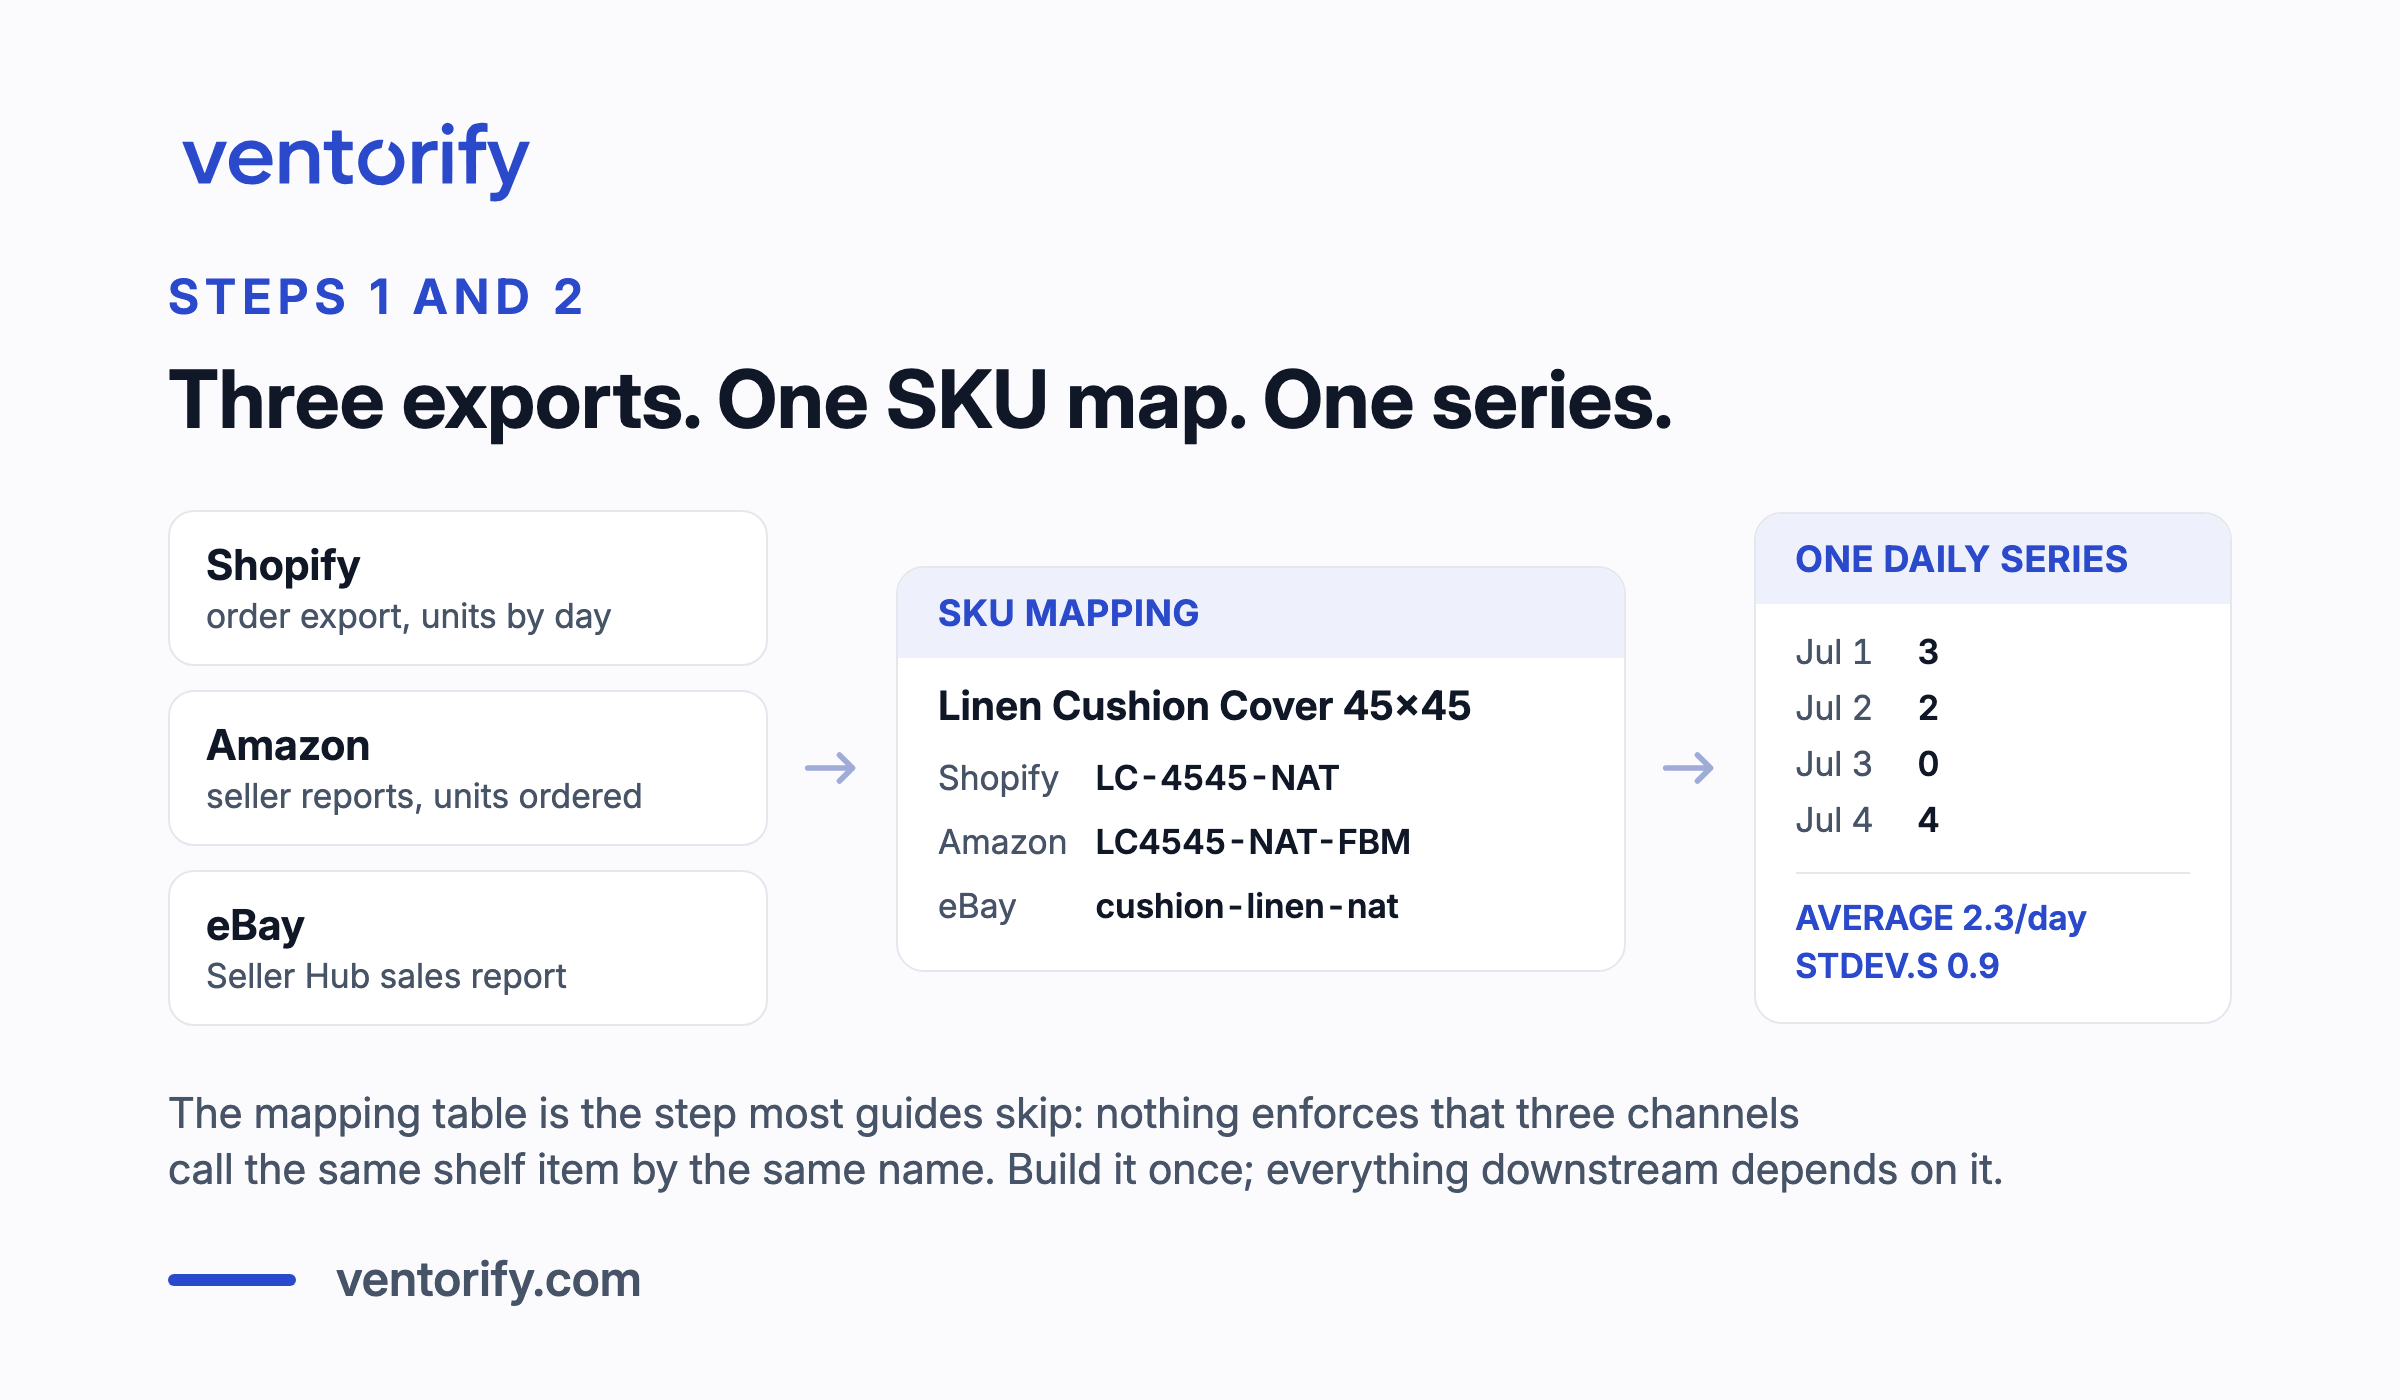
The goal of this step is one table per channel: date, SKU, units sold. Ninety days is enough to estimate an average and a spread for a product that sells steadily; take more if you have it.
Every channel can produce this, though none of them call it the same thing. From Shopify, export orders or use a sales report with units per product per day. From a marketplace like Amazon or eBay, use the seller reporting area, which for Amazon means the seller reports section and for eBay lives in Seller Hub. You want units ordered by day and by SKU. Revenue reports are the wrong export: they answer a different question and blend price changes into what should be a unit count.
Two exclusions while you are here. Drop cancelled orders and orders refunded before shipment, since stock never left for them. And drop any test orders you placed yourself.
Then comes the step that makes the rest possible: the SKU mapping. The same physical product usually carries a different identifier on each channel. The cushion cover that is LC-4545-NAT in Shopify might be a seller SKU with a suffix on Amazon and a custom label on eBay, and nothing anywhere enforces that they match. Build the mapping table once, one row per physical product, one column per channel identifier. It is unglamorous, it takes an afternoon for a few hundred SKUs, and every multichannel calculation you ever do afterwards depends on it. If two channel listings map to the same shelf item, they are one row. That includes the case where one channel sells a two-pack: two units of shelf stock per order, which the export will not do for you.
Step 2: build one daily series per SKU and clean it
Merge the three tables through the mapping into one sheet: one row per calendar day, one column per SKU, units summed across channels. Align everything to one timezone first, because a marketplace reporting in UTC and a shop reporting in local time will disagree about which day an evening order belongs to.
Fill the gaps deliberately. A day with stock on the shelf and no sales is a real zero and belongs in the series. A day where the product was out of stock is not a zero, it is a missing value, and it gets excluded: an out-of-stock day says something about your supply and nothing about your demand. Mark promotion days too, and either exclude them or accept that they inflate the average. The one-line versions of these rules are here; the reasoning, and the ways an uncleaned series quietly corrupts a forecast, are covered in the pillar's section on building the demand series.
Now compute the two demand numbers per SKU, straight from the spreadsheet: AVERAGE over the cleaned series for average daily demand, and STDEV.S over the same range for the standard deviation of daily demand. Keep both. The average sets the target, the spread sizes the buffer, and getting this far is most of the work. Ordering late is the expensive direction to be wrong in: IHL Group's 2025 inventory distortion research puts the worldwide cost of out-of-stocks at $1.2 trillion, roughly double the $572 billion it attributes to overstocks (IHL Group).
Step 3: measure lead time from your own purchase orders
The supplier's quoted lead time is not an input to anything. It is a number from a sales conversation. The input is your own receiving history: for the last 10 to 20 purchase orders per supplier, the days between sending the order and receiving the goods. Average those to get lead time, and take the standard deviation of the same list to get lead time variability, the second spread the formula needs.
Decide which received date you mean before you start. A partially delivered order has two candidates, the day the first carton arrived and the day the order was complete, and they can be weeks apart. For a reorder point, the completion date is the honest one.
If you have fewer than ten purchase orders with a supplier, you cannot measure a spread worth trusting. Use the quote, add a wide margin, and label the number as what it is: a placeholder until your own history exists.
Step 4: choose a service level and compute
The service level is the probability of not running out during a replenishment cycle, and it enters the formula as a multiplier called Z: roughly 1.65 at 95%, 2.05 at 98%, 2.33 at 99%. Higher protection costs disproportionately more buffer, so not every SKU deserves the same level. Give your A products a high one and let the C products run leaner, a trade the pillar's service level section walks through. Deciding which products are the A products is its own job, and on several channels the report in your Shopify admin is not the place to get the answer. Which variant of the safety stock formula a SKU needs in the first place, and the slow movers where none of them apply, is covered in why one formula does not fit every SKU.
Safety stock combines both spreads you measured. Demand uncertainty and lead time uncertainty both widen what can happen while you wait for a delivery, and the standard formula combines them:
σ over lead time = √( lead time × σ²(daily demand) + (daily demand)² × σ²(lead time) )
Safety stock is Z times that, and the reorder point is lead time demand plus safety stock. Here is the whole thing end to end, with round numbers chosen for the arithmetic rather than measured from anything.
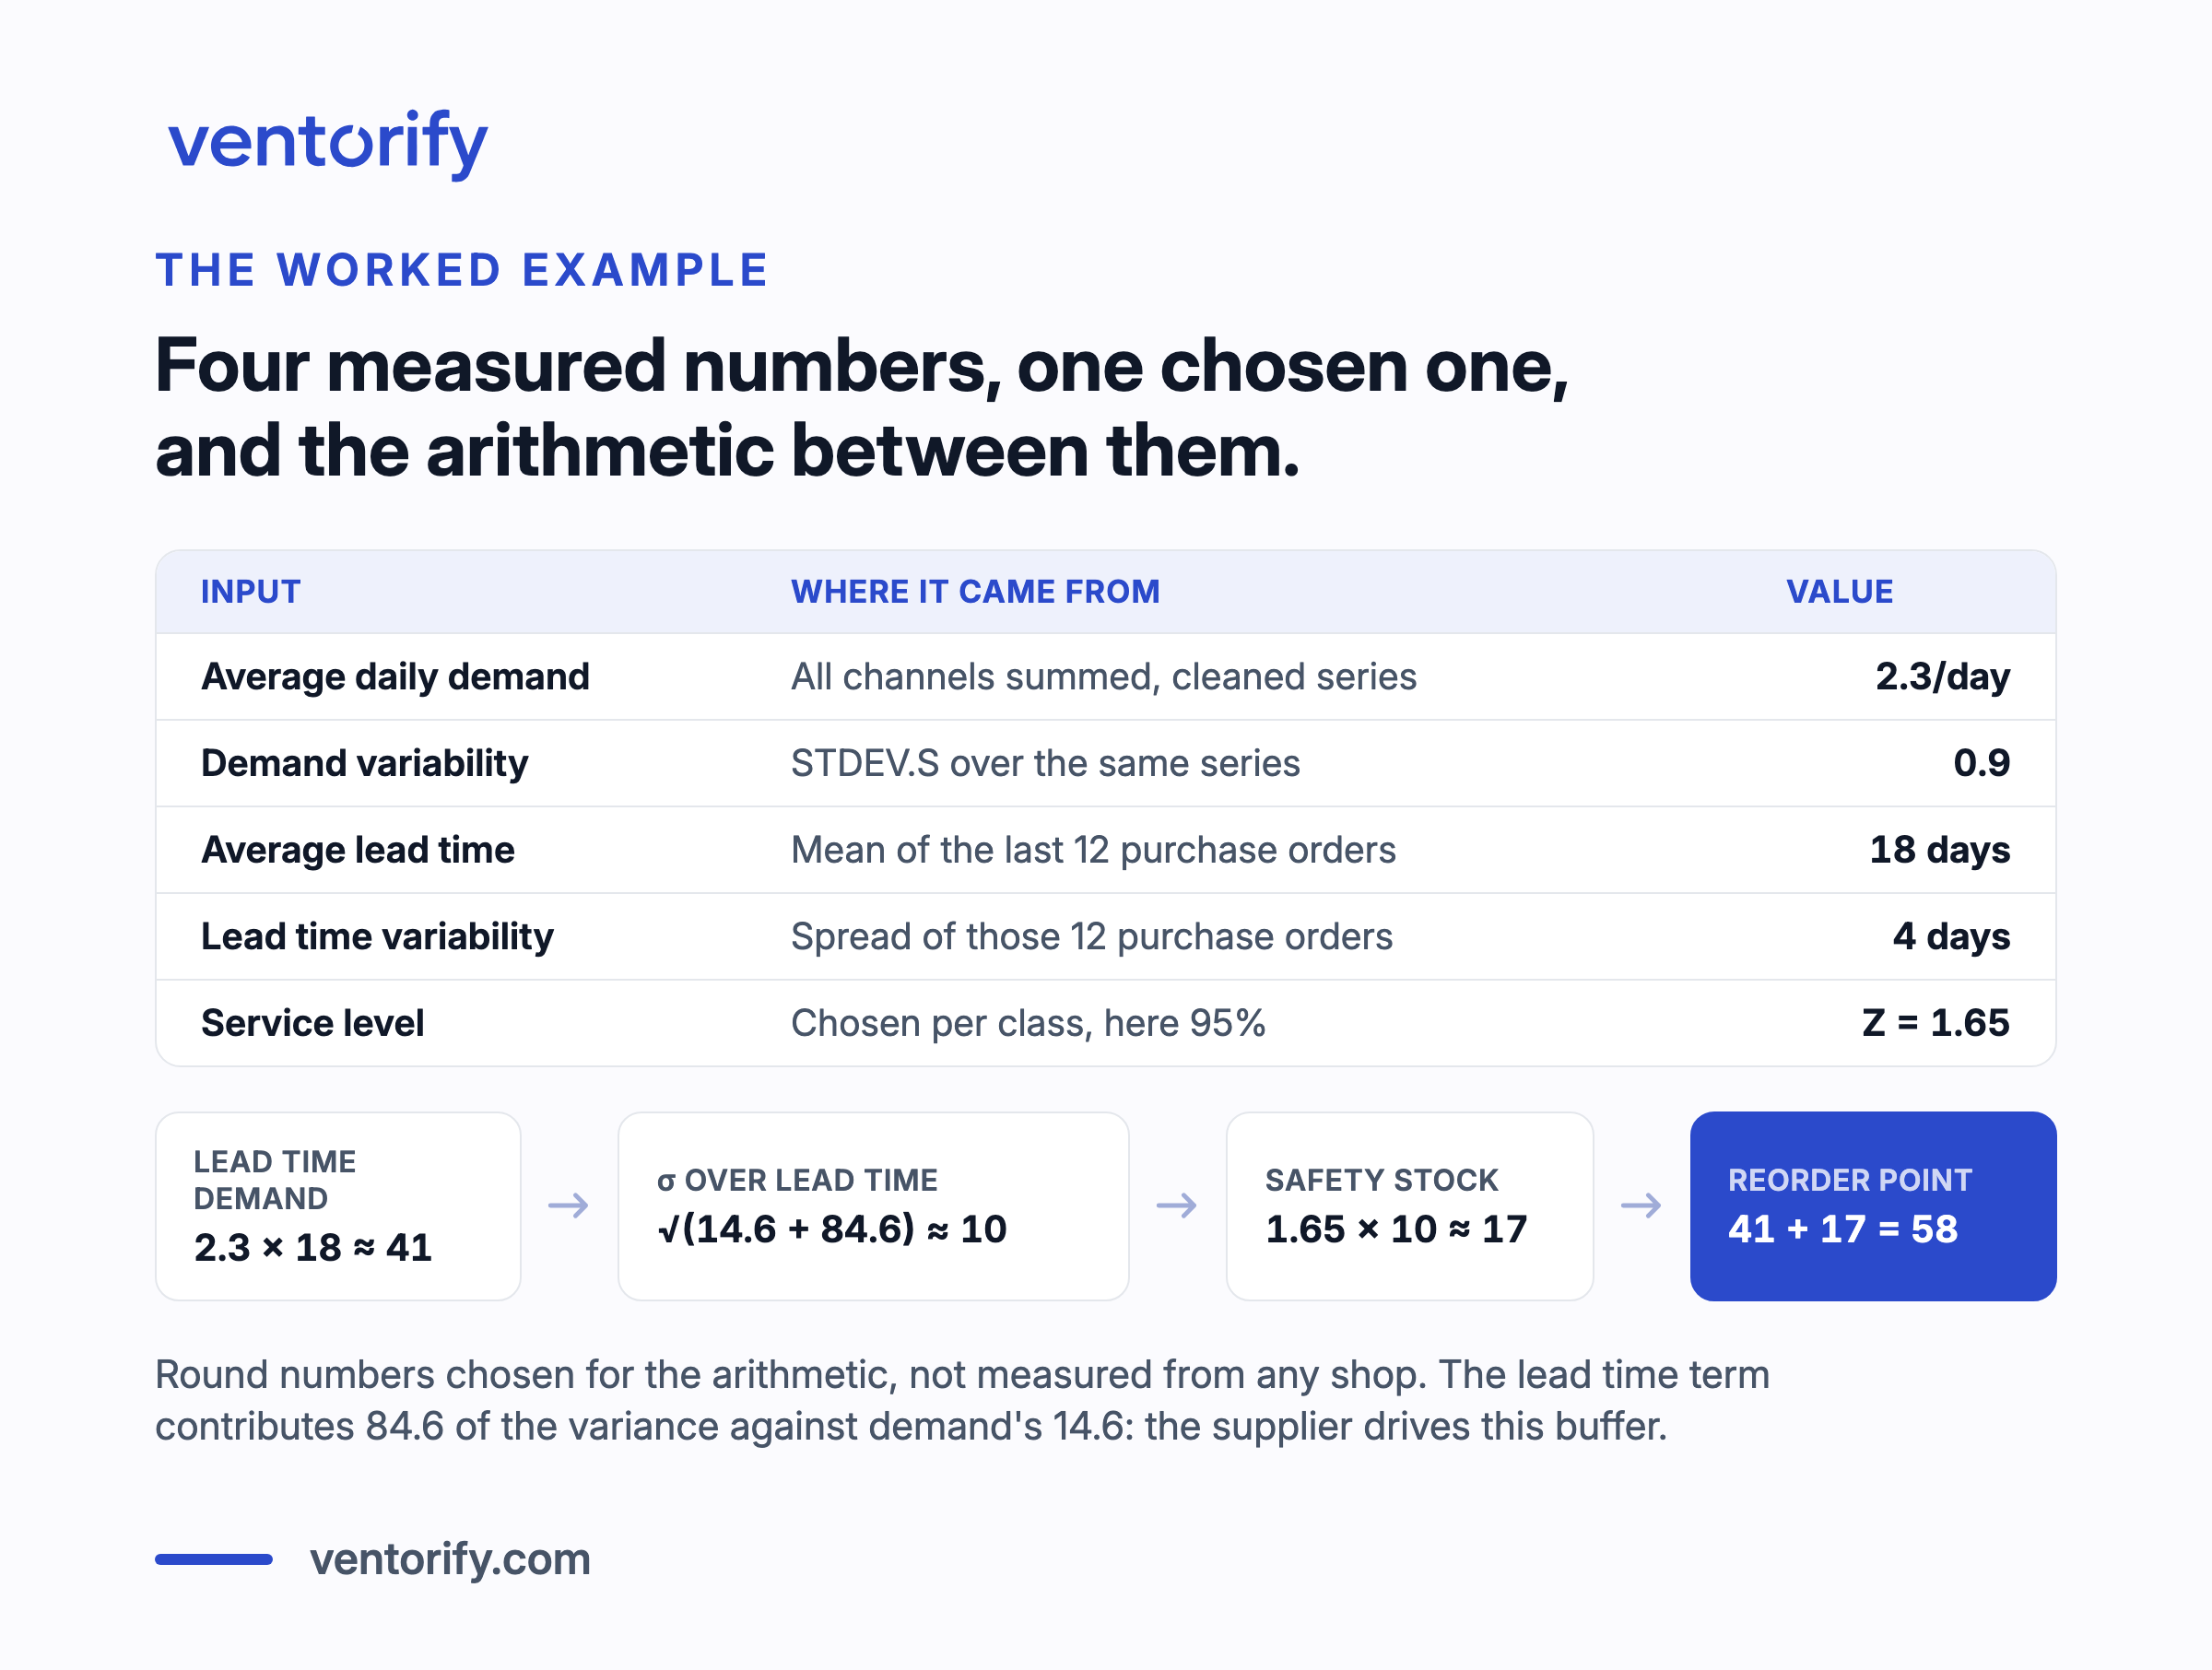
The Linen Cushion Cover, LC-4545-NAT, sells 1.2 a day on Shopify, 0.7 on Amazon and 0.4 on eBay. Combined demand is 2.3 a day, and the cleaned series has a standard deviation of 0.9. The supplier's last twelve purchase orders averaged 18 days, quote notwithstanding, with a standard deviation of 4 days. Service level: 95%, so Z is 1.65.
- Lead time demand: 2.3 × 18 ≈ 41 units.
- σ over lead time: √(18 × 0.81 + 5.29 × 16) = √(14.6 + 84.6) ≈ 10 units.
- Safety stock: 1.65 × 10 ≈ 17 units.
- Reorder point: 41 + 17 = 58 units.
When available stock for this SKU touches 58, you order. Worth pausing on the middle line: of the two terms under that square root, the lead time term contributed 84.6 and the demand term 14.6. The supplier's wandering delivery dates, far more than the customers, are what set the size of this buffer, and that is the usual result, not an artefact of the example. Ignore lead time variability and safety stock comes out near 6, a buffer that history says this supplier will eat.
Step 5: round the trigger into an order you can place
The reorder point says when. It says nothing about how much, and the quantity you want is rarely the quantity you can order. Suppose the cushion cover's supplier, Nordform Keramik, has a minimum order quantity of 24 and ships in packs of 12. If your calculation says you need 52 units to get back to a comfortable level, the order you can place is 60: rounded up to a full pack, comfortably past the minimum. Round up, not down. Rounding down converts your safety stock into a rounding error.
Write the constraints next to the supplier in your sheet, and treat the rounded number as the real order. Order quantities, and what minimums and pack sizes do to them at scale, deserve their own treatment as part of the purchasing workflow, which is a separate cluster of decisions from the trigger this post computes.
When to redo this, and when the method is the wrong one
A reorder point is a measurement, and measurements age. Redo the calculation quarterly as a habit, and immediately when something structural moves: a new channel comes online, a supplier changes or visibly drifts, a listing wins or loses a search position and the velocity shows it.
Know the two cases where this procedure misleads. A SKU that sells in occasional bursts, a few times a month with zeros between, breaks the averages this method rests on; the pillar's model selection section covers what replaces smoothing there. And a SKU with only a few weeks of history cannot give you a trustworthy spread at all. The honest output for that SKU is "not enough data", not a confident number with a decimal point.
This is also the honest place for the one product note on this page. Everything above is arithmetic, and doing it once by hand is the best way to understand your own stock. Doing it every quarter, per SKU, per supplier, with lead times re-measured from actual receipts and service levels set per class, is a job for software; that job is what Ventorify's forecasting and reorder engine automates, from the same combined-channel logic this post walks through.
Frequently asked questions
What is the reorder point formula?
Reorder point = (average daily demand × lead time) + safety stock. Average daily demand is the total across every channel that sells from the same pool of stock, lead time is measured from your own receiving history in days, and safety stock is the buffer sized from the variability of both.
Do I need a separate reorder point for each sales channel?
No, not when the channels sell from one pool of stock. One pool, one drain rate, one reorder point per SKU. Separate calculations become legitimate when stock is physically separated, for example units held in a marketplace's fulfilment network, which are their own pool with their own replenishment question.
Does Shopify calculate reorder points automatically?
No. Shopify's native inventory tooling has no automatic per-SKU reorder point or demand forecast; its documented mechanism is minimum and maximum threshold fields set per variant through custom metafield definitions (Shopify Help Center). We compared what the native tooling does and does not cover in our guide to Shopify's native inventory after Stocky.
How often should I recalculate a reorder point?
Quarterly, as a standing habit, because demand and lead times both drift. Sooner if something structural changes: a channel added or removed, a new supplier, a price change, or a sustained shift in velocity that you can see in the weekly numbers.
Where this leaves you
The five steps, as a checklist:
- Pull 90 days of per-SKU order history from every channel.
- Reconcile the identifiers into one SKU mapping.
- Build one cleaned daily series per SKU and take its average and spread.
- Measure lead time and its spread from your own purchase orders.
- Pick a service level per class, compute safety stock from both spreads, and round the resulting trigger up to an order your supplier will accept.
None of it needs more than a spreadsheet, and the first pass by hand pays for itself in understanding. The formula was never the hard part. The inputs were, and now you have them.